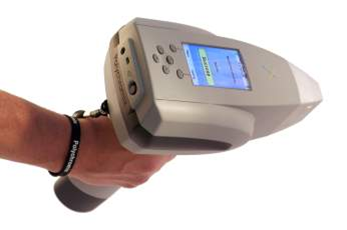
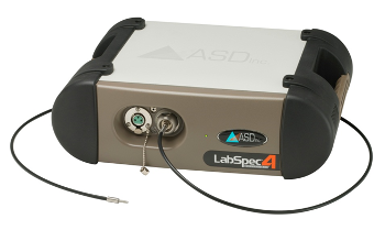
The PHAZIR and ASD data are constituted of absorbance NIR spectra acquired from fresh wood samples with the Polychromix (today Thermo Fisher Scientific) PhazirTM handheld spectrometer and ASD (today Malvern Panalytical) LabSpec 4 spectrometers, respectively. Samples were taken from two tree species: quaking aspen (Populus tremuloides Michx.) and balsam poplar (Populus balsamifera L.) that will be later on referred to as A and P, respectively. Samples were slowly oven-dried in three successive steps to reduce their moisture content. At each step, the cross (transverse) section of each sample was scanned at 6 different locations with both spectrometers (see details below). At the end of this process, the samples were oven-dried at 103 ± 2 °C and their moisture content (MC) was determined a posteriori according to ASTM D4442-07. Note that MC was measured on a dry basis (mass of water/mass of dry wood).
- The PHAZIR is a handheld micro-electro-mechanical system (MEMS) based digital transform spectrometer (DTS) working in the NIR range from 939.5 nm to 1796.6 nm (with a resolution of about 11 nm). The illumination spot diameter of the PHAZIR was 7 mm. The spectrometer has a single InGaAs detector instead of a detector array, which has the advantage of eliminating detector-element variability as a source of noise (Day et al., 2005). The 6 spectra acquired with the PHAZIR were automatically averaged and stored in a CSV file named PHAZIRspectra.csv. The structure of this file is presented in details here. We will refer to it as the PHAZIR data or PHAZIR spectra. See this article for more details about the PHAZIR data.

- The ASD LabSpec 4 is an instrument working in the VIS-NIR range from 350 nm to 2500 nm (with a resolution of 1 nm). The illumination spot diameter of the contact probe used to collect the spectra was 10 mm. The instrument is actually composed of three separate spectrometers acquiring data from the VNIR (350 - 1000 nm), SWIR1 (1000 - 1800 nm) and SWIR2 (1800 - 2500 nm) regions of the spectrum. The VNIR spectrometer uses a fixed concave holographic reflective grating to disperse the light onto a fixed photodiode array. SWIR1 and SWIR2 both use a concave holographic reflective grating that rotates, allowing the light to be measured on a single fixed InGaAs detector (see the ASD technical guide for details). The 6 spectra acquired with the ASD LabSpec 4 were separately saved in .ASD format and subsequently converted to .SPC format using the ASDtoSPC (v.6.0.1) converter software. These .SPC files are stored in three separate folders (one for each drying step) under the general folder ASDspectra and were named based on the scan number. We will refer to these data as the ASD data or ASD spectra.

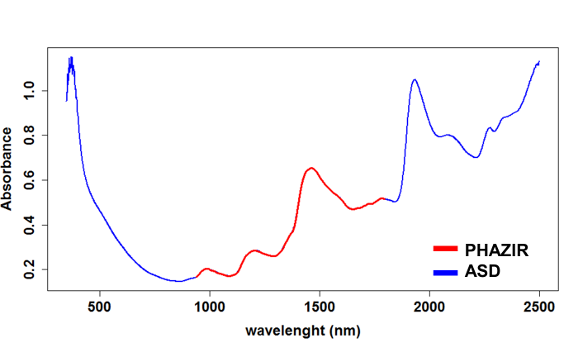
A comparison of the PHAZIR and ASD spectra acquired from a wood sample is given below.

Finally, the MC values measured by oven-drying the samples in the laboratory were stored in a separate file named refData.csv. This file also contains the drying step number (1, 2 or 3), the species identification character (A or P), the sample number and the PHAZIR and ASD spectrum reference number corresponding to each sample. The structure of this file is presented in details here. We will refer to it as the reference data.